Intracochlear Pressure Measurements
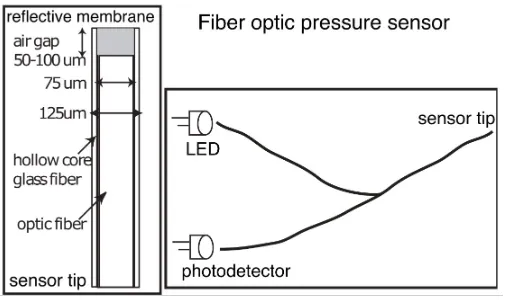
Diagram of the fiber optic pressure sensor, which takes the intracochlear pressure measurements: Olson, 1998, Olson & Nakajima, 2015.
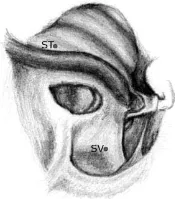
Diagram of Cochlea
Sensor was threaded through cochleostomies to access scala vestibuli (SV) near the stapes (this measures cochlear input pressure) and scala tympani (ST) in turn 1, where it approached the basilar membrane to measure pressures corresponding to the cochlear traveling wave. Diagram is from gerbil.
In addition to the usual ST and SV measurements, one set of measurements was done in scala media (Kale and Olson, 2015).
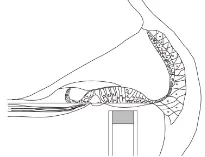
Sensor Location in Cochlea
A diagram of the fiber optic pressure sensor close to the basilar membrane in scala tympani.
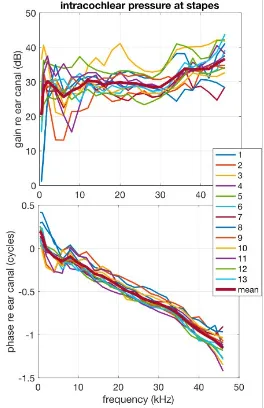
Scala Vestibuli Pressure at the Stapes
Scala vestibuli pressure at stapes relative to ear canal pressure. 13 examples and the mean.
The gain is quite flat and the phase is a line of approximately constant slope: corresponding to a frequency-independent delay.
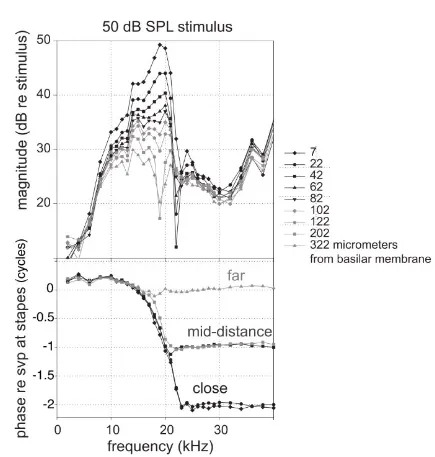
Scala Tympani Pressure at Various Distances from the Basilar Membrane
Scala tympani pressure at various distances from the basilar membrane. The traveling wave emerges at distances of ~ 200 um and closer.
See for example, Olson, 1998, 1999, Dong & Olson 2005, 2009 (gerbil), Nakajima et al, 2008 (human cadaveric measurements).
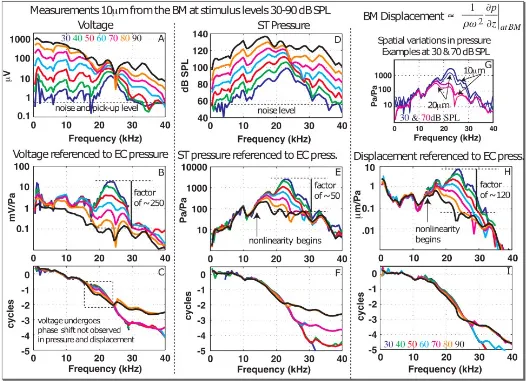
Measurements with an Electrode
In later measurements, an electrode was adhered to the side of the pressure sensor to measure voltage and pressure simultaneously (Dong & Olson, 2013, 2016).