Optical Coherence Tomography
Background
The mammalian auditory organ, the cochlea, is a remarkable biological machine. In all auditory systems, mechanical vibrations induced by external pressure are transduced into electrical signals that are transmitted to the brain. The threshold of human hearing, 0 decibels of sound pressure level (dB SPL) corresponds to a pressure wave with an amplitude of 20 micropascals or 0.2 billionths of the ambient atmospheric pressure in the ear canal. At this pressure, the sensory tissue within the cochlea, termed the organ of Corti, vibrates with an amplitude on the order of a few Ångstroms; which corresponds to motion comparable to the size of single molecules. Moreover, most large mammals can hear and communicate at frequencies well into the tens of kilohertz range, with rodents being able to hear at up to 80 kHz, and some cetacean species being able to hear at up to 200 kHz. The auditory system relies on an active process, or cochlear amplifier, to boost its internal vibrations and achieve these feats. Studying the micromechanics of the cochlea, or, more colloquially figuring out how the ear hears, has been a formidable challenge for a variety of biological and technical issues. The cochlea's complex three dimensional architecture is essential for its role as a frequency analyzer but this morphology makes it difficult to resolve the motion at any one position. The high frequencies involved demands that any imaging techniques must be able to operate in the tens to hundreds of kilohertz range. Moreover, the sensory tissue is encased in a bony protective shell termed the otic capsule and the entire auditory apparatus is embedded in the temporal bone, one of the hardest bones in the mammalian skeletal system, which requires requires relatively invasive procedures to access the sensory tissue.
Optical Coherence Tomography (OCT) is an imaging modality that uses broad-band infrared (IR) light to form images of biological tissue with a penetration depth of few millimeters. The axial (in the direction parallel to the light's path) and lateral (in either of the two orthogonal directions) resolutions of an OCT are on the order a few microns, sufficient for identifying different structures within the organ of Corti and the penetration depth of a few millimeters allows researchers to image the cochlear tissue in a relatively non-invasive manner, thus preserving the delicate and metabolically sensitive processes that contribute to the organ's operation. Finally, OCT has a functional extension, termed Spectral Domain Phase Microscopy (SDPM) or Phase Sensitive OCT that allows the same instrument to be used as a sensitive vibrometer meaning that one can simultaneously, or nearly simultaneously, take detailed morphological images and then measure the vibrations.
How does OCT imaging work?
The instrument used in the Fowler Memorial Laboratory is termed a Fourier Domain, or Spectral Domain, OCT system. In spectral domain OCT, a broad-band infrared light source is used to generate a beam containing many frequencies (or wavelengths) simultaneously. A portion of the light is passed through a reference arm and the rest of the signal is shone onto the sample where the different wavelengths are reflected by the various layers in the tissue and then interfere with each other either constructively or destructively. The two light beams are them recombined in an interferometer, separated into different wavelength bins using a spectrometer, and sent to a one dimensional line camera which records a raw spectrum, essentially a plot of the intensity of the reflected light as a function of wavelength.
A mathematical operating, termed a Fourier transform, then takes the spectrum into a one dimensional map, termed an Ascan or axial scan, of the intensity as a function of the depth direction. These steps are demonstrated in the following figures, where we have imaged a single mirrored surface and, serving as a simulacrum of more complex system, multiple layers of transparent cellophane tape atop a mirror.
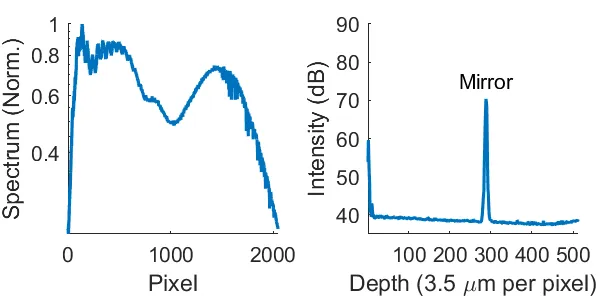
The left panel shows the raw spectrum (plotted on a normalized scale) and the right panel shows the resulting uniaxial image, or Ascan, generated by a single reflective surface; in this case, a piece of reflective metal acting as a mirror.
Imaging More Complex Strcutures
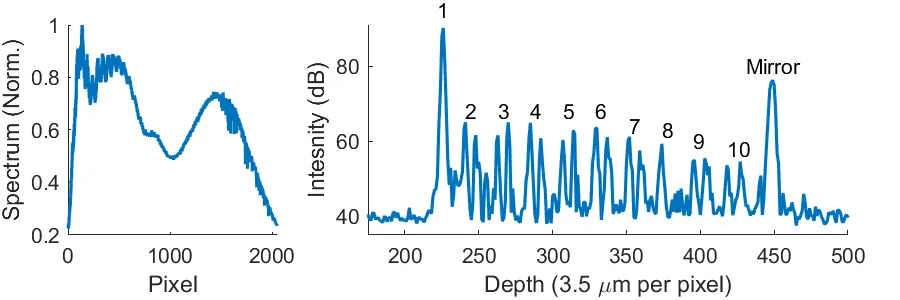
As a more complicated and interesting demonstration of OCT imaging, here we show the raw spectrum (again plotted on a normalized scale) and the resulting Ascan of ten layers of Scotch tape atop a mirrored surface. Note that the Ascan has multiple peaks, each corresponding to one of the layers of tape and finally, at the lowest position, the mirrored surface. The total depth of this sample is approximately 225 microns which is about twice the diameter of a human hair.
Two and Three Dimensional Scanning
Of course, one is not simply interested in one dimensional maps of the reflectivity vs. depth at a single location. OCT can be used to take two dimensional images and three dimensional (or volumetric images). In the two dimensional case this is achieved by scanning the light across the sample in one (lateral direction) and performing the spectum to Ascan transformation at each location. Assembling these individual scans creates a two dimensional image or Bscan (brightness scan). This is somewhat analogous to the inner workings of (the now obsolete) cathode ray tube television sets where the image was formed from 486 lines scanned in the horizontal direction.
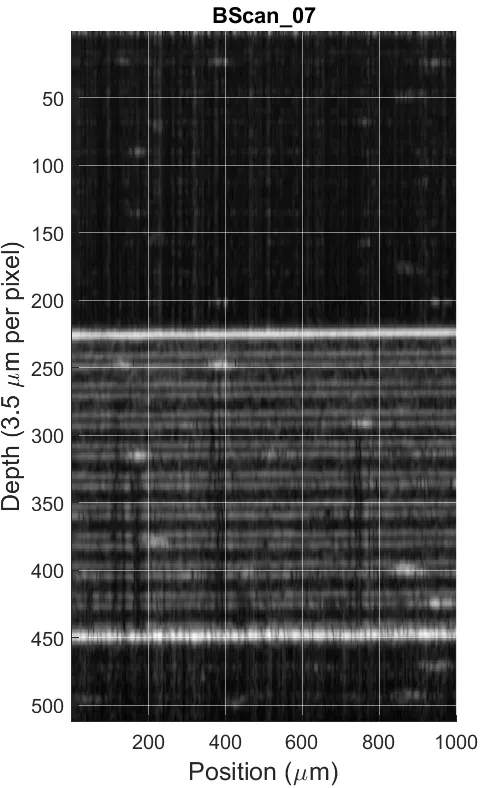
Two dimensional Bscan of the Scotch tape and mirror showing all the layers.
Finally, by scanning in a second orthogonal direction, the OCT can take 3 dimensional or volumetric images revealing the internal structure of the sample. The following animation shows the organ of Corti at the 45 kHz location in a gerbil cochlea. The surfaces are shown as individual 2D images, or slices, rotated about the optical axis.
Cochlear Vibrometry with OCT
As mentioned above, a fundamental problem in auditory mechanics is understanding the vibrations of the sensory tissue within the cochlea. Spectral Domain Phase Microscopy (SPDM) or Phase Sensitive OCT is a functional extension that allows the same instrument to be used as a sensitive vibrometer. As mentioned above, each Ascan in an OCT image is formed by taking the Fourier transform of the raw spectral data; in the images above these Ascans are plotted as the magnitude, or absolute value, of the Fourier transforms. But in addition to carrying information about the magnitude of a time dependent signal, the Fourier transform also encodes the phase. If the structures being imaged are stationary, then all of the phases in the transform will be constant. Now suppose that the reflective surfaces in the sample are vibrating, and the amplitudes of the vibrations are smaller than the axial resolution of the instrument, or smaller than one pixel in the resulting Ascans. The instrument now takes a sequence of time-locked Ascans, termed a Motion scan or Mscan. In this case, each component in the Fourier transform will have a time dependent phase that is proportional to the instantaneous displacement of that structure. Inverting this relationship gives one a record of the instantaneous displacement as a function of time for each of the reflective surfaces at the location point where the Mscan was recorded. Some representative vibrometry data from a live cochlea are shown in the figure below. Because the same instrument can perform both the imaging and the vibrometry measurements, it is possible to match the vibrations with precise anatomical locations.
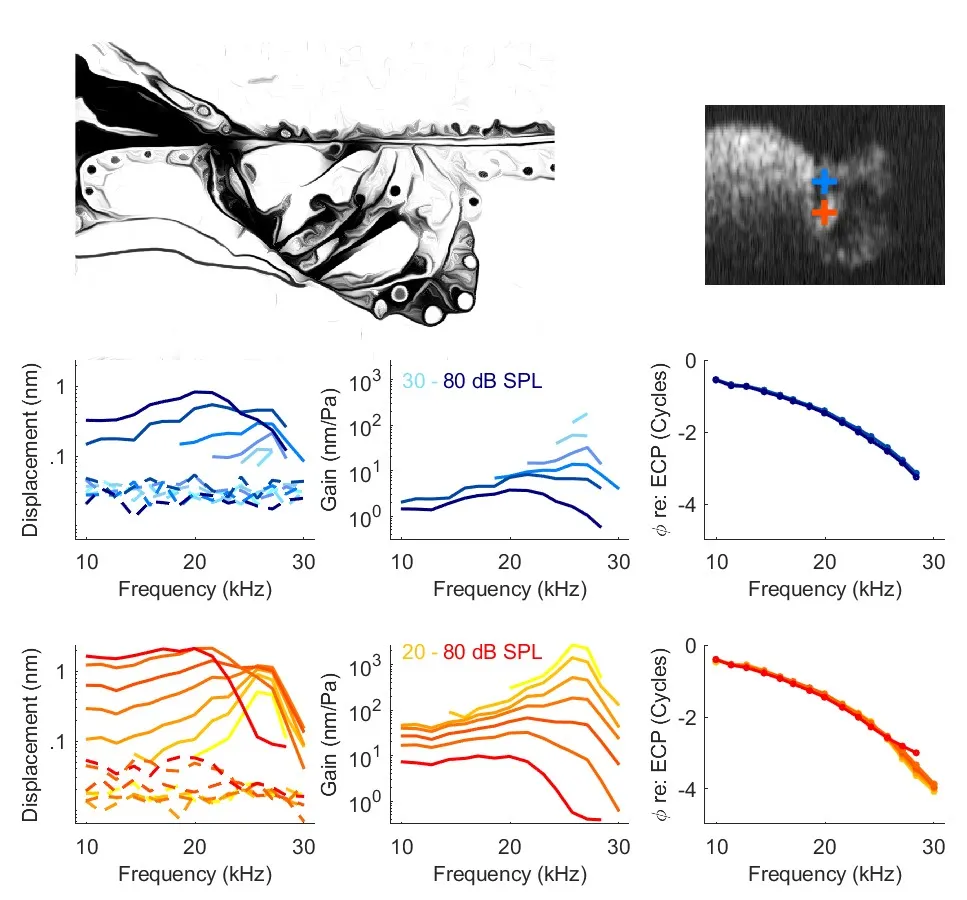
Vibrations within the Organ of Corti. The cartoon at the top left is a schematic diagram of one cross sectional region of the organ of Corti. The image at the right is a Bscan taken at the 25 kHz location in a gerbil cochlea and the blue and orange crosses mark the basilar membrane and outer hair cell (OHC) region, two structures whose vibrations are of great interest to those who study auditory mechanics. The next two rows show the BM vibrations (plotted in shades of blue) and the OHC-region (plotted in shades of orange) measured from 20 to 80 dB SPL. The right panels show the raw displacement amplitudes in nanometers at each frequency; the middle panels show the gain or amplification which is the amplitude per unit pressure level in nanometers per pascal; and the final panels show the phase delay referenced to the ear canal pressure. In this experiment, the sound pressure was varied from 20 dB SPL, approximately the loudness of leaves rustling in the wind, to 80 dB SPL, approximately the loudness of a vacuum cleaner or noisy restaurant. Note that there are both similarities and differences between the vibrations at the two locations. For both structures, the the vibrations are tuned, that is the amplitude, or gain, is highest at the best frequency, about 25 kHz in this example; and the vibrations are nonlinear, that is the gain varies with different sound pressure levels. A major qualitative difference between the vibrations of the two structures is that the OHC-region's regions vibrations show nonlinearity at frequencies well below the best frequency.
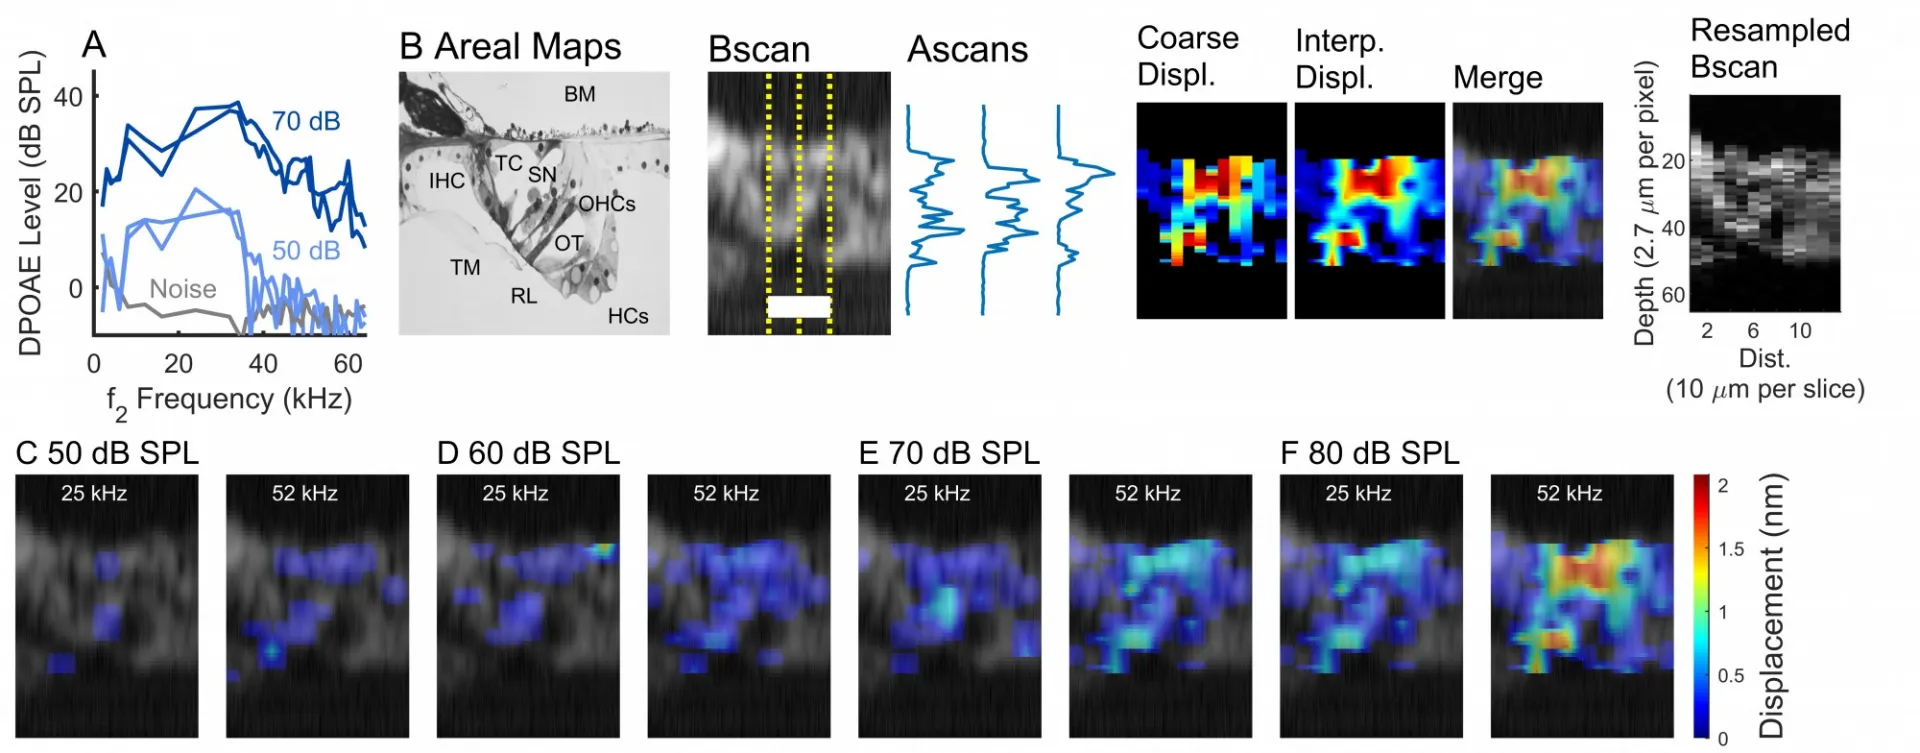
Just as an OCT can generate two dimensional images by scanning in the lateral direction, it is possible to measure two dimensional, or areal, vibration patterns by taking a sequence of closely spaced uniaxial vibration measurements with a known separation. This is demonstrated in the following figure where we show the spatial vibration patterns at four levels from 50 to 80 dB SPL and two frequencies, the approximate best frequency, about 52 kHz in the example, and at a frequency about half this value. For clarity, we have plotted the vibration maps atop the anatomical Bscan to show how the various structures vibrate. As part of the routine measurements, we measure distortion product otoacoustic emissions (DPOAEs) which are faint intermodulation tones generated by the cochlea when two or more frequencies are presented simultaneously. These DPOAEs are used to assess the general health of the ear.
Current Projects
In spite of many decades of progress, the precise workings of the mammalian auditory system are not fully understood. In the Fowler Laboratory, the OCT is used in a number of ongoing projects. Some of these include: (1) Investigating whether interspecies differences in cochlear mechanics and hearing in general may be explained by morphological differences in the micromechanical architecture of the organ of Cort. (2) The use of pharmacological agents to study individual components of the active process. The cochlear amplifier relies on a number of feedback mechanisms to achieve the sharp frequency selectivity and low thresholds characteristic of a healthy ear. We have used a number of ototoxic drugs, such as furosemide and salicylate, to selectively and reversibly knock out individual components of the active process. (3) The effects of intense low-side suppressor tones on the vibrations of various structures in the organ of Corti.